近日,厦门大学电子科学与技术学院吴挺竹教授、王树立助理教授团队在微流控技术制备量子点色转换层用于micro-LED全彩化显示领域取得重要进展,相关成果以“Microfluidic-Based Patterning of High-Resolution, Uniform Luminescent, and Low Optical Crosstalk Quantum Dot Arrays for Full-Color Micro-LED Displays”为题发表于中国科学院1区TOP期刊ACS Photonics。
量子点(QD)颜色转换层(CCLs)为实现全彩micro-LED显示提供了一种经济且可靠的方法。微流控技术在图案化和集成多色QD方面展现出显著优势,包括高精度、快速加工和低制造成本。然而,用于QD分散的非极性溶剂易引起聚二甲基硅氧烷(PDMS)微通道膨胀,制备具有低光学串扰的高分辨率CCLs仍然具有挑战性。在本研究中,我们开发了一种含有聚合物添加剂的QD溶液,该溶液有效抑制了PDMS的膨胀,使得在小尺寸PDMS微通道中注入QD溶液成为可能。所制备的QD CCLs表现出高发光均匀性,分辨率高达1,285 ppi,子像素尺寸为5 μm × 5 μm。此外,我们创新性地集成了铬图案化微孔玻璃基板,有效消除了CCLs中子像素间的光串扰。通过将优化后的QD CCLs与蓝色GaN micro-LED阵列集成,我们成功制备分辨率为600 ppi、色域覆盖率达115% NTSC的全彩micro-LED。
厦门大学为该文章的第一署名单位,该项研究工作是在吴挺竹教授、王树立助理教授共同指导下完成,2023级博士生严梓峻与2025级博士生王煜辉为论文共同第一作者。研究工作得到工业和信息化部项目、国家自然科学基金、福建省自然科学基金、福建省科技计划区域发展项目、中央高校基本科研业务费专项资金和厦门市自然科学基金青年项目等资助。
文章链接:
【图片导读】
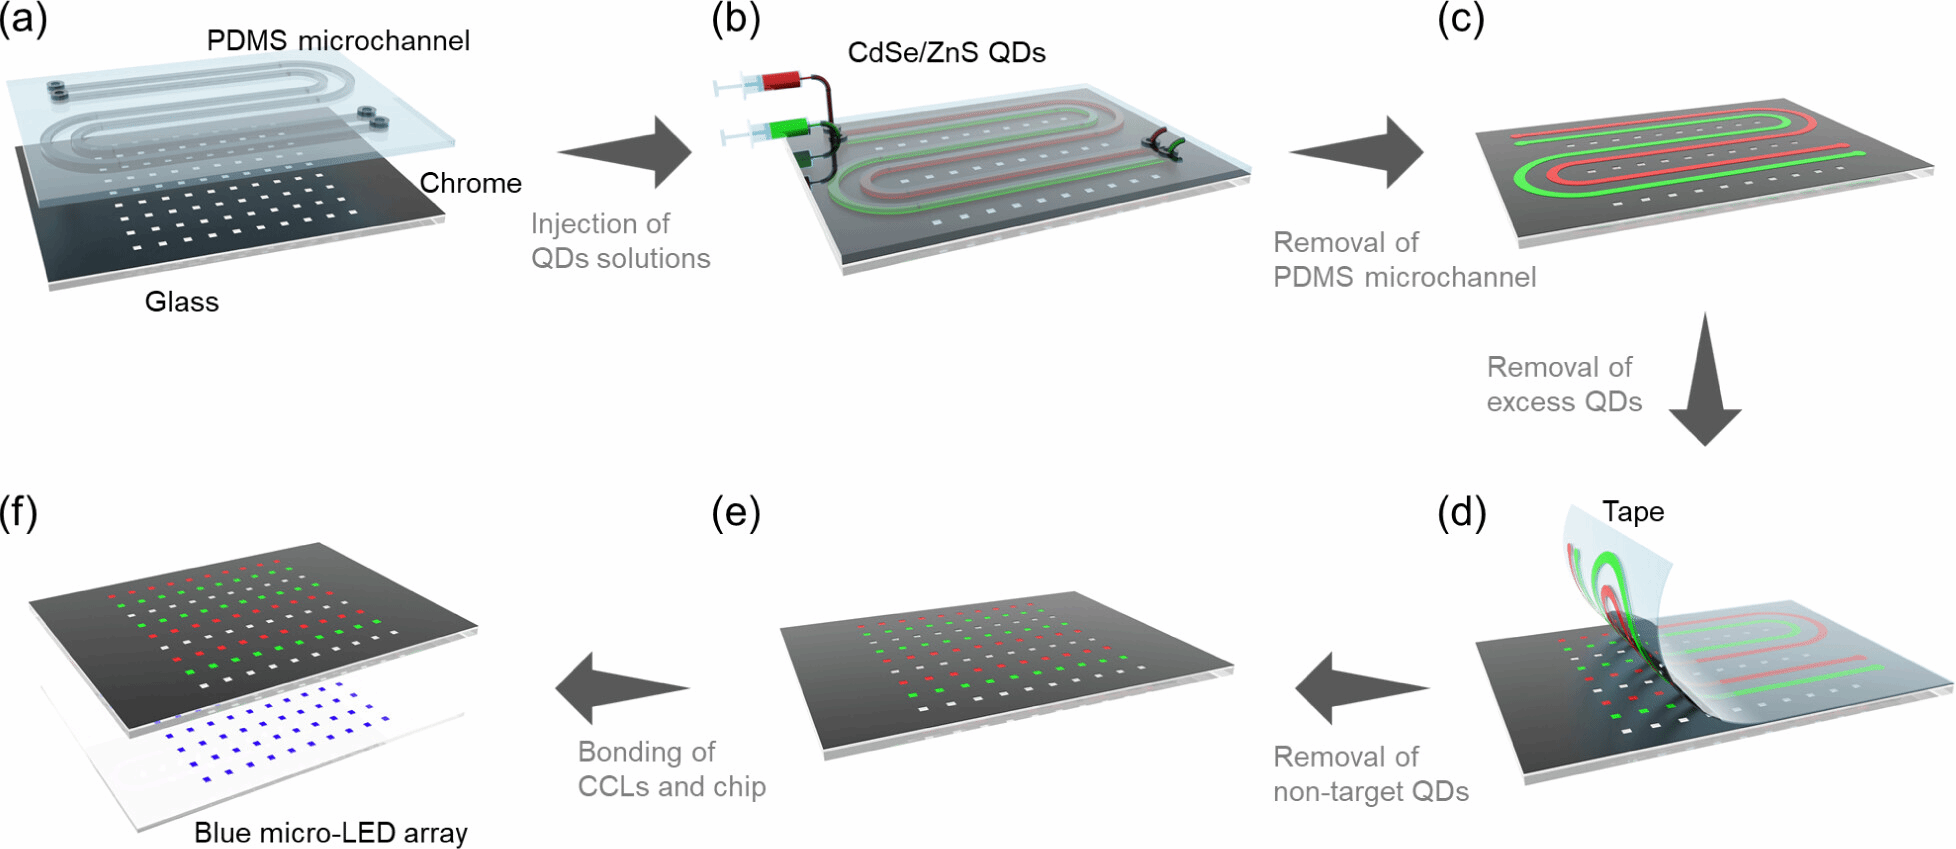
Figure 1. Schematic illustration of the preparation of QD CCLs by PDMS–glass microfluidic device. (a) Bonding of PDMS microchannel with a selectively chromium-deposited and microhole-arrayed glass substrate. (b) Injection of red and green QD solutions. (c) Deposited QD patterns after peeling off the PDMS microchannel. (d) Removal of excess QDs by tape. (e) Separately deposited red and green QD CCLs. (f) Bonding of CCLs with a blue micro-LED chip for constructing a micro-LED full-color display device.
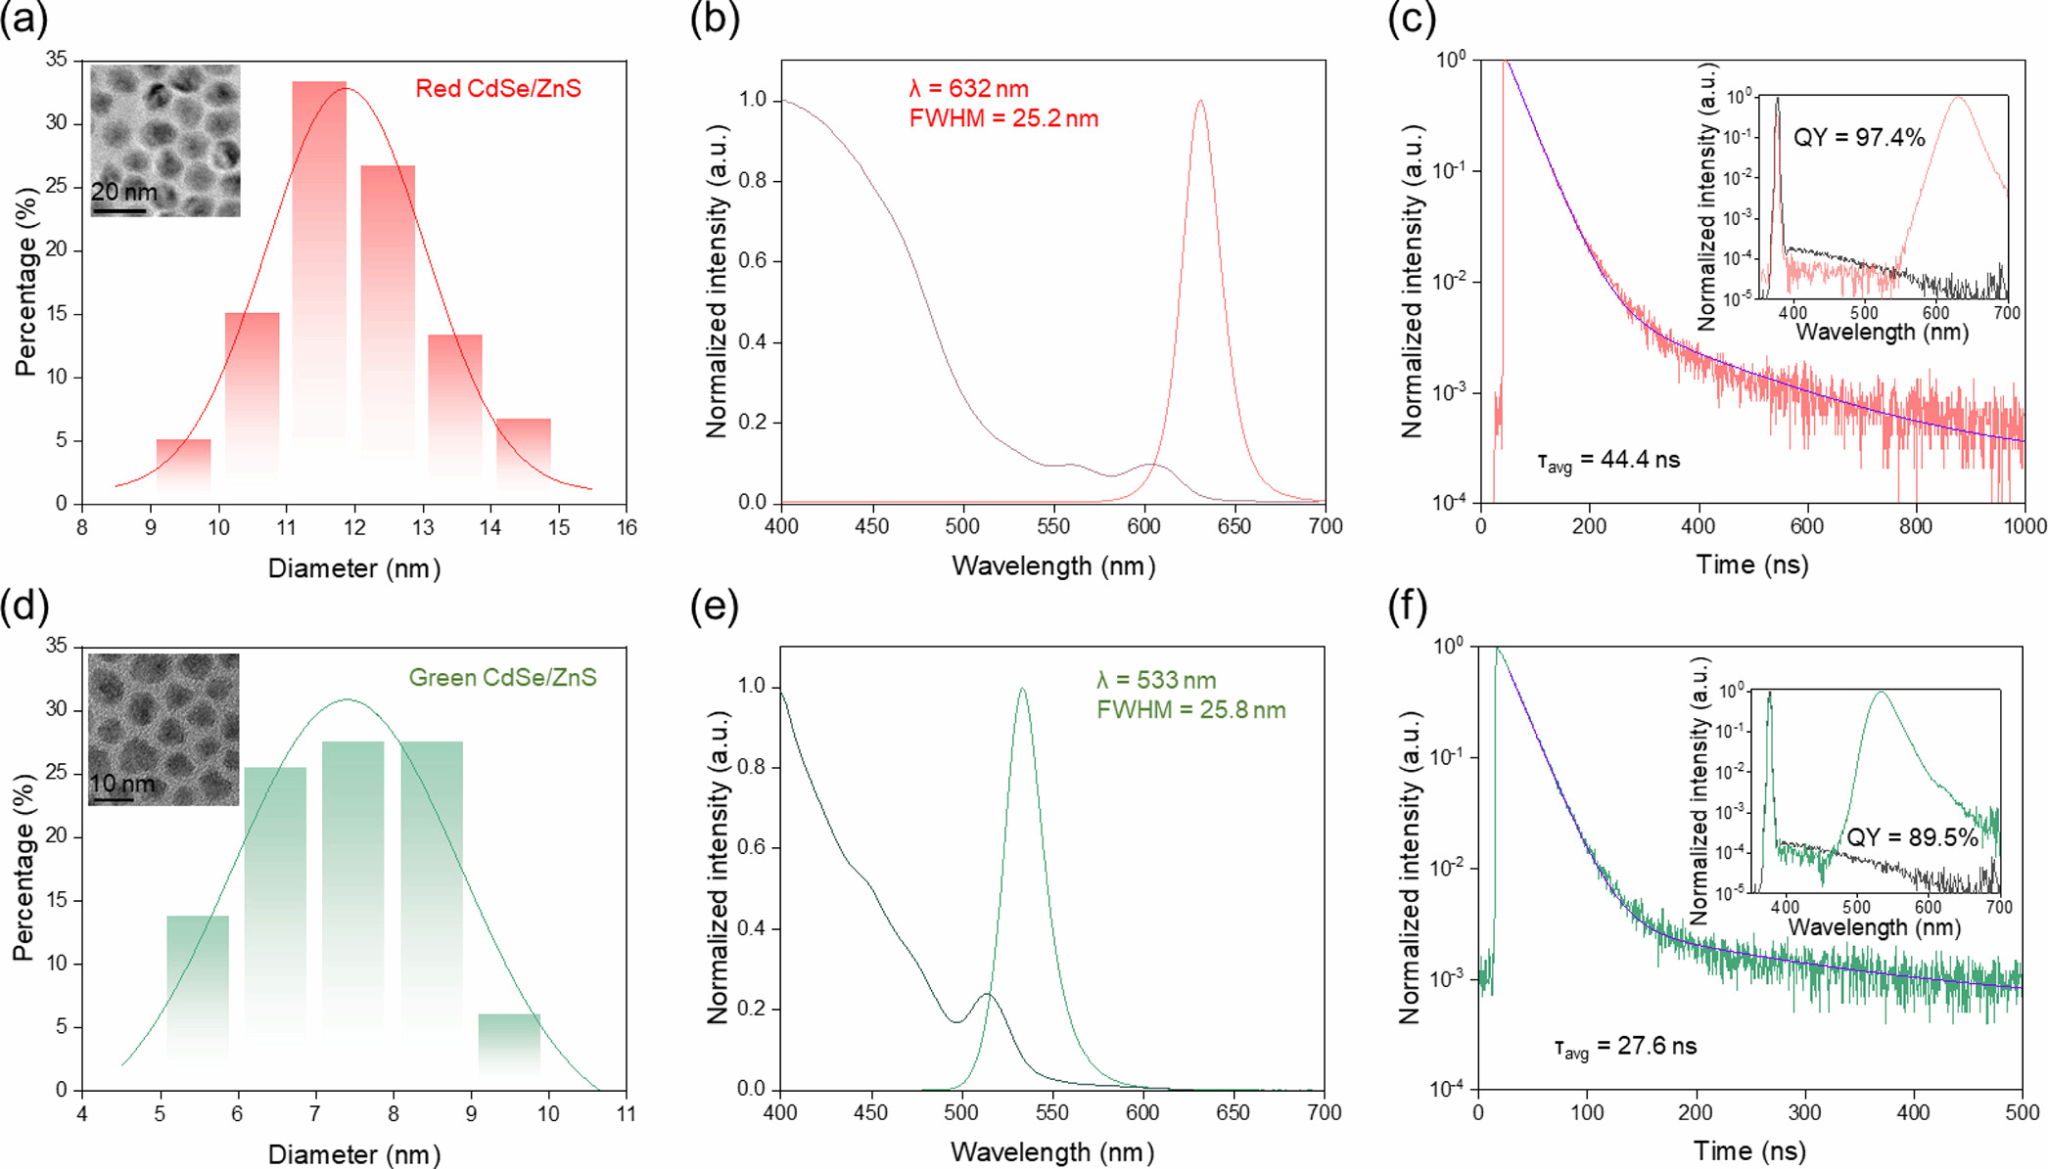
Figure 2. TEM and size distribution of (a) red and (d) green CdSe/ZnS QDs. Absorption and PL spectra of (b) red and (e) green CdSe/ZnS QD solutions. PLQY and TRPL decay curves of (c) red and (f) green CdSe/ZnS QD solutions.
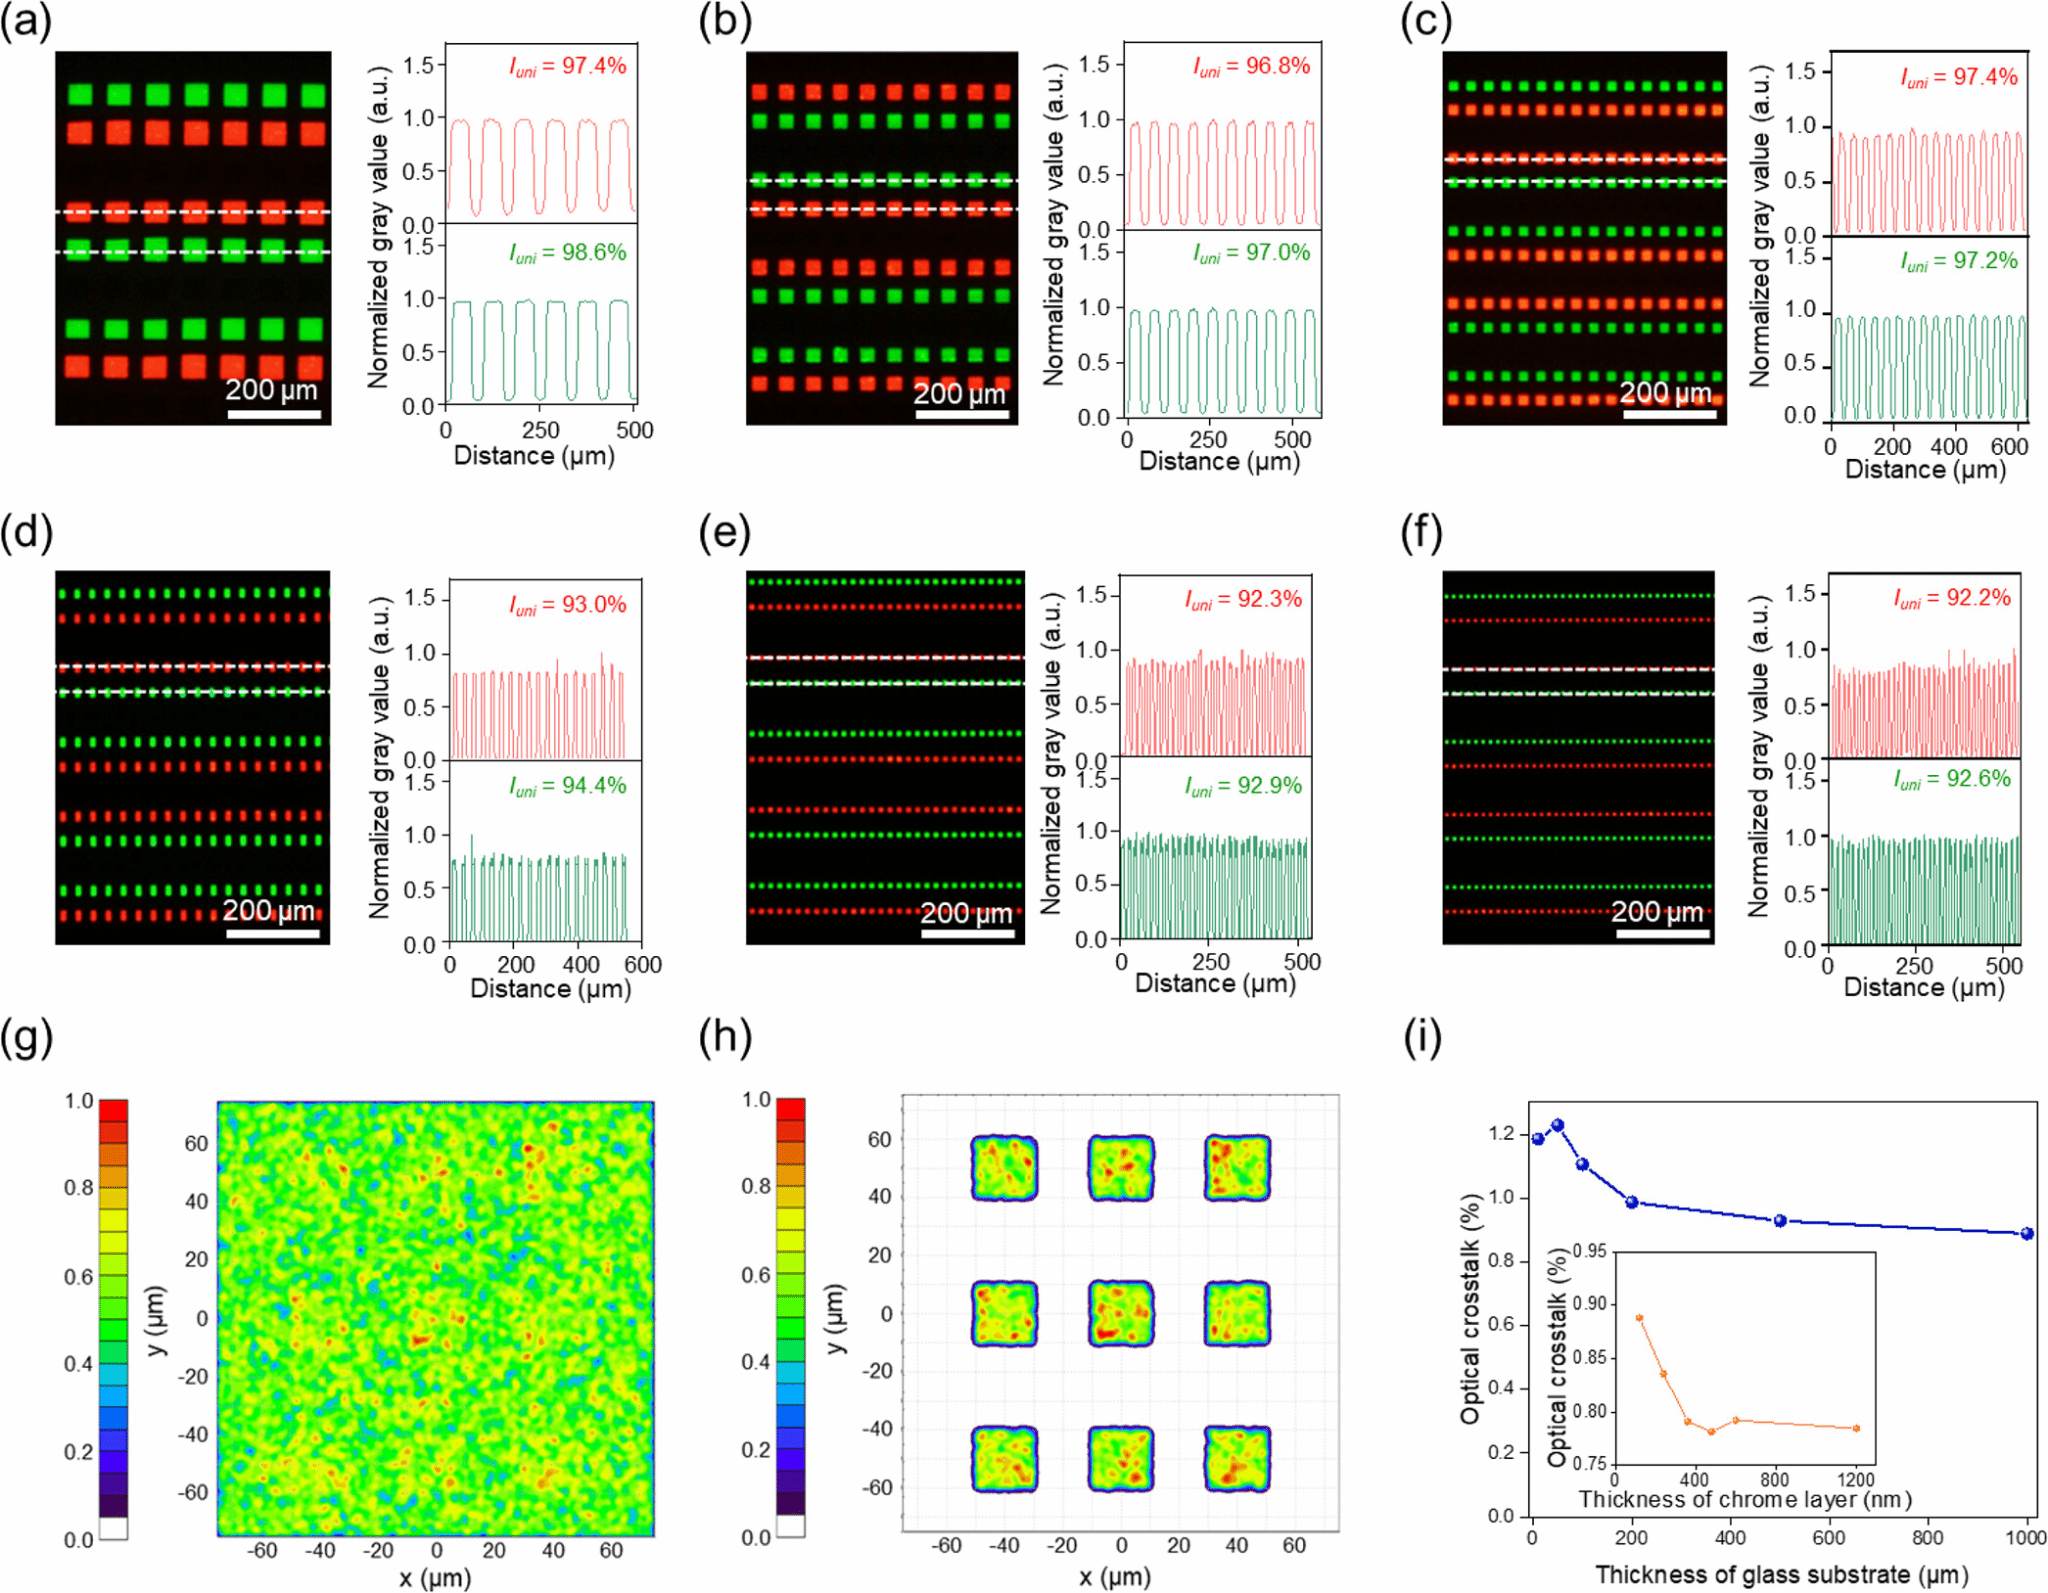
Figure 3. Fluorescence images and fluorescence intensity distributions of red and green two-color CCLs with subpixel sizes of (a) 50 μm × 50 μm, (b) 30 μm × 30 μm, (c) 20 μm × 20 μm, (d) 20 μm × 10 μm, (e) 8 μm × 8 μm, and (f) 5 μm × 5 μm. Irradiance maps of the full-color micro-LED device (g) without and (h) with a patterned chrome layer using TracePro simulation software. (i) Relation between the optical crosstalk rate and the thickness of the glass substrate and chrome layer.
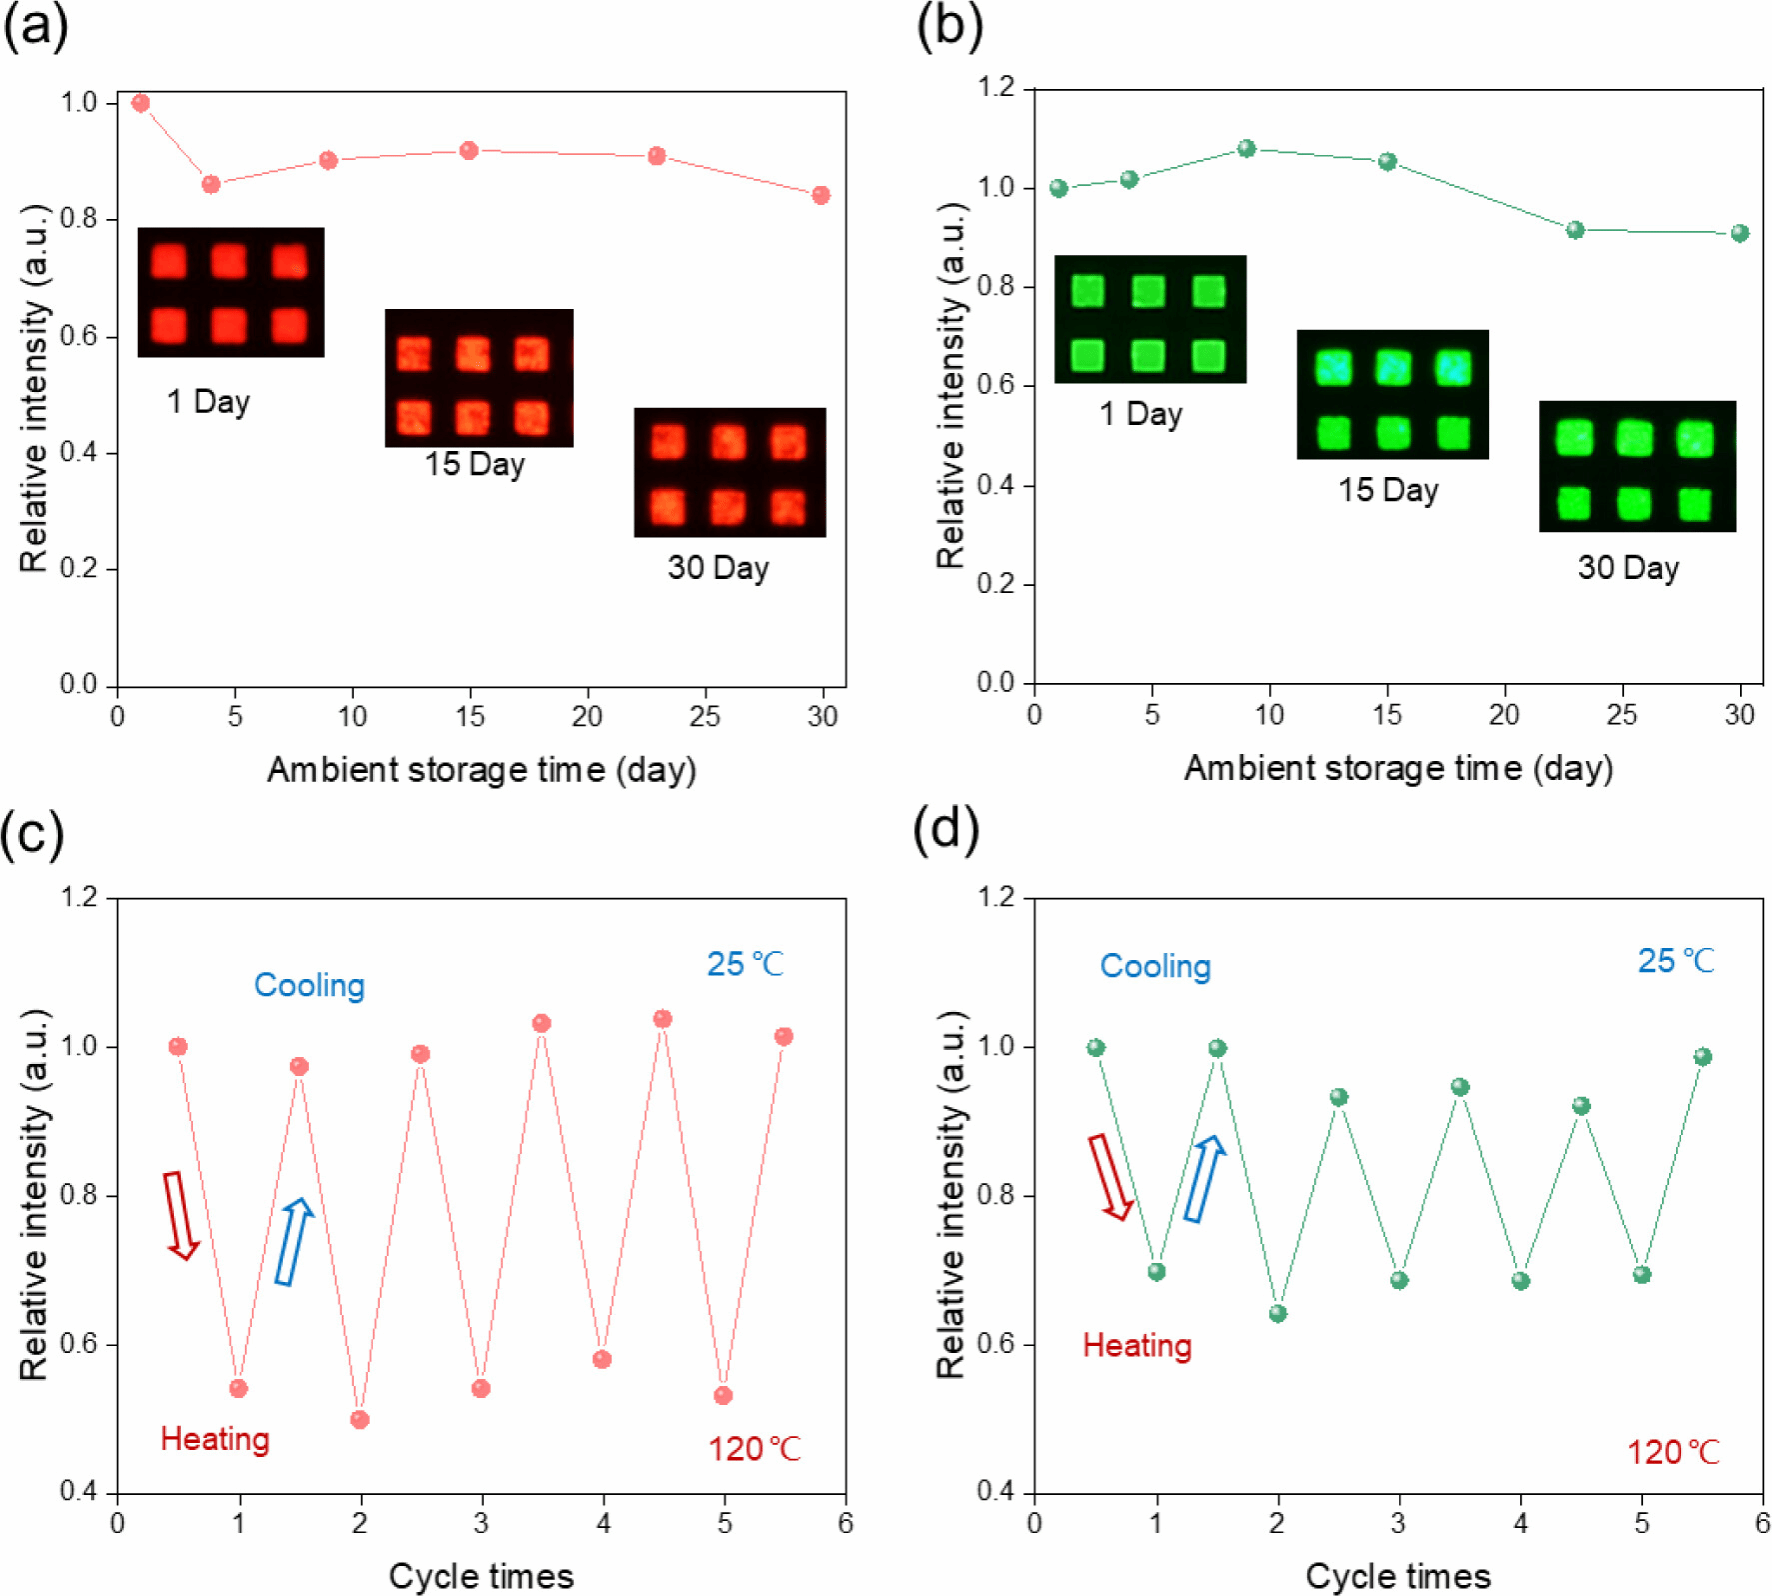
Figure 4. Temporal evolution of the PL intensity of (a) red and (b) green CdSe/ZnS arrays during ambient storage (25 °C and 70% room humidity). The insets comprise fluorescent photographs of the CCLs on the respective days: day 1, day 15, and day 30. The change in relative PL intensity of (c) red and (d) green CdSe/ZnS arrays upon five heat–cool cycles between 25 and 120 °C.
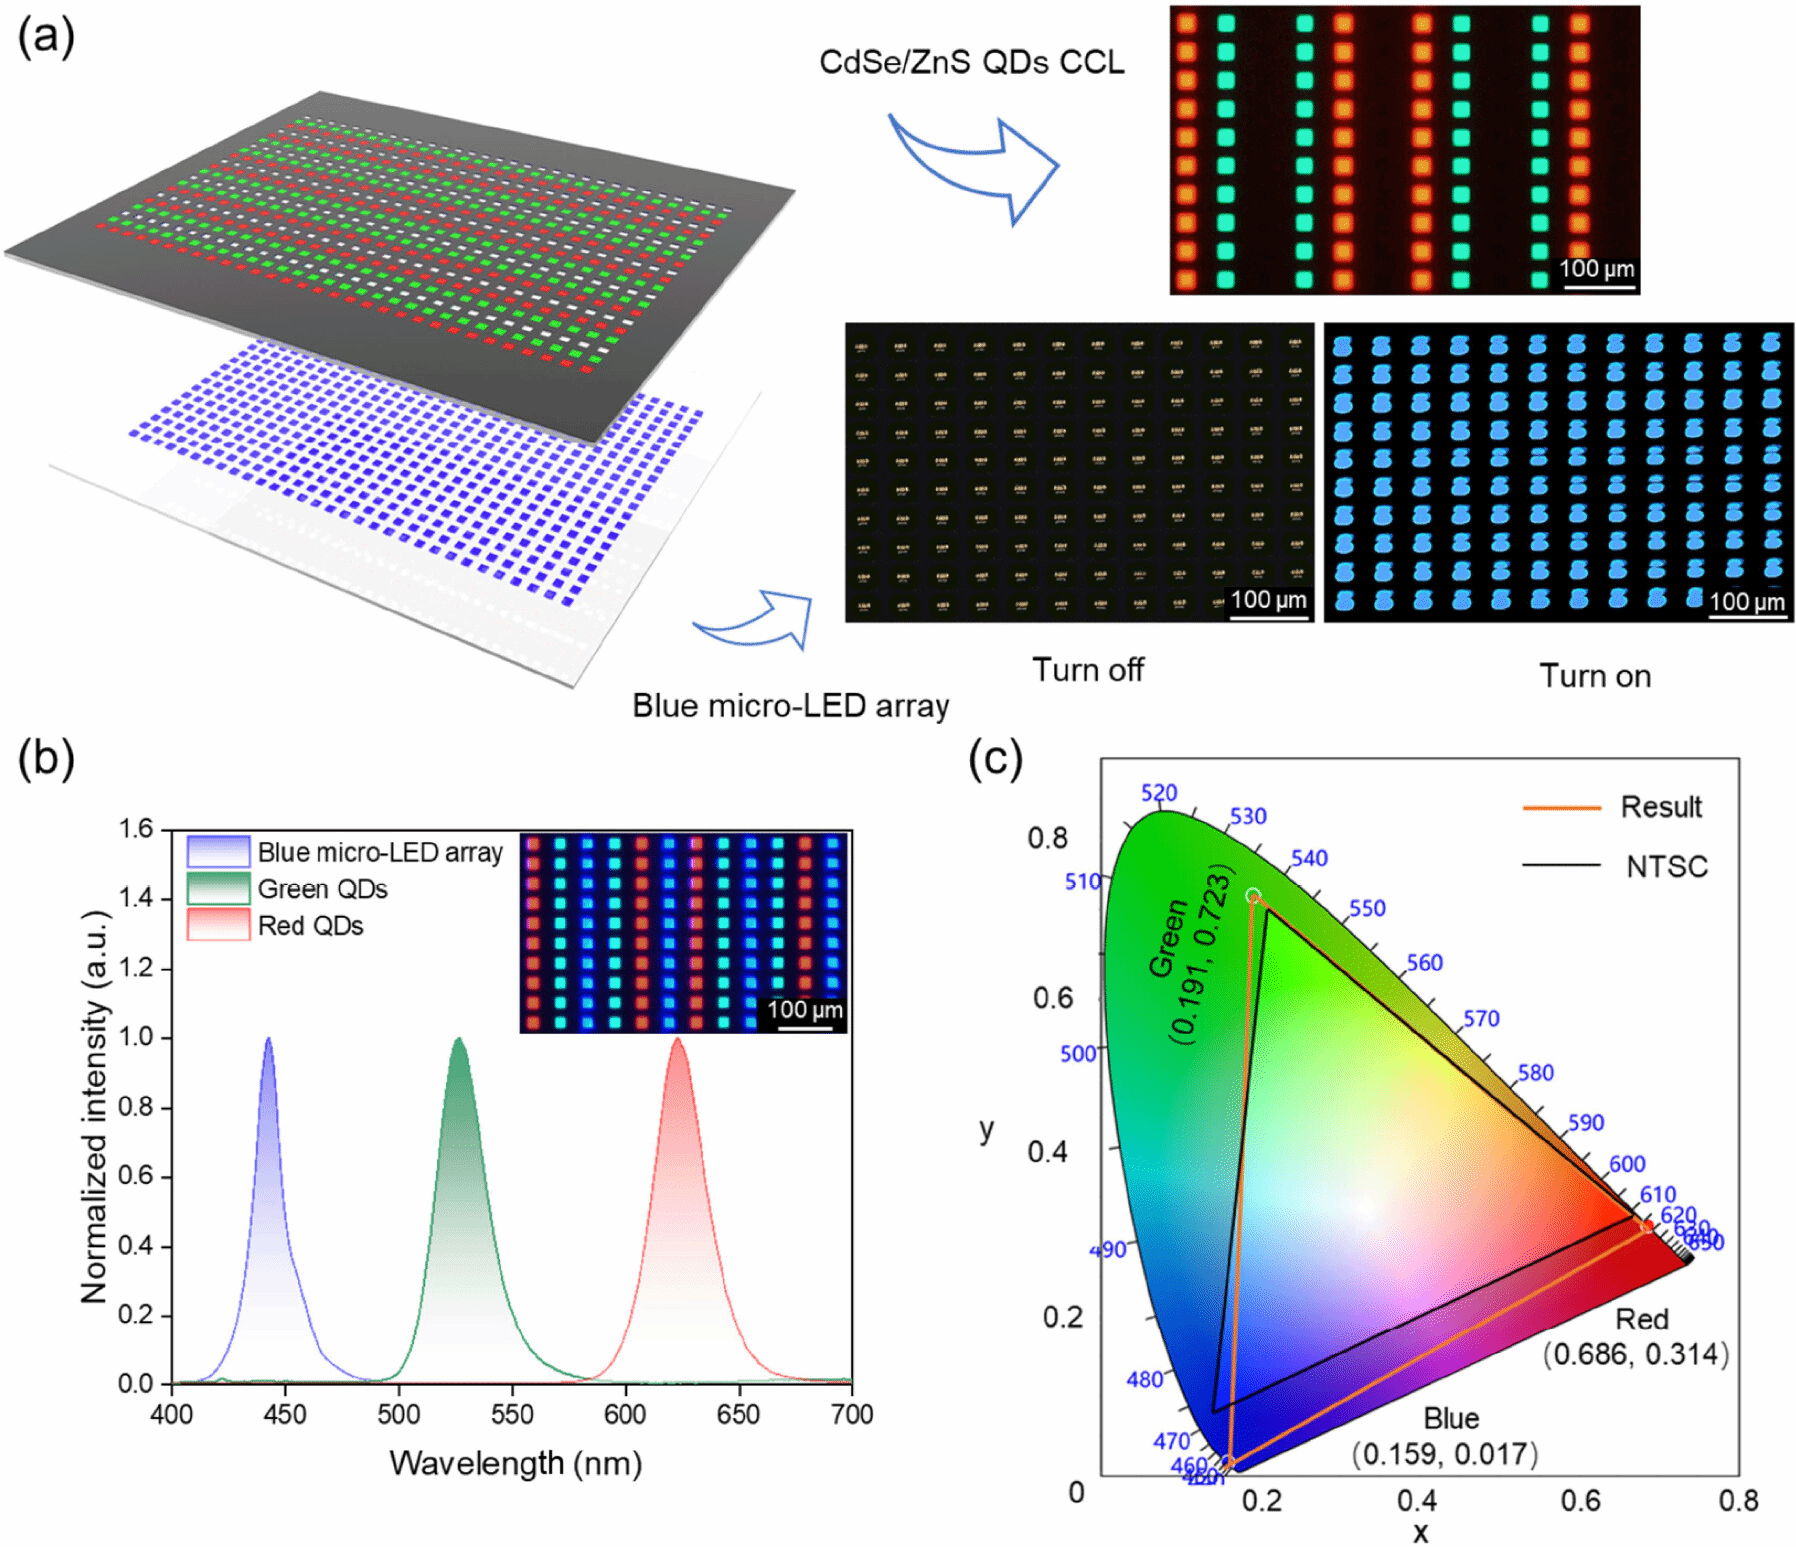
Figure 5. (a) Schematic illustration of the full-color micro-LED display device prototype and microscopy images of the blue micro-LED chip and red and green QD CCLs. (b) EL spectrum of blue micro-LED chip and PL spectra of red and green QD CCLs. The inset shows the microscopic image of the color conversion full-color micro-LED device prototype in the turned-on state. (c) Color gamut of the color conversion-based micro-LED full-color display device.